
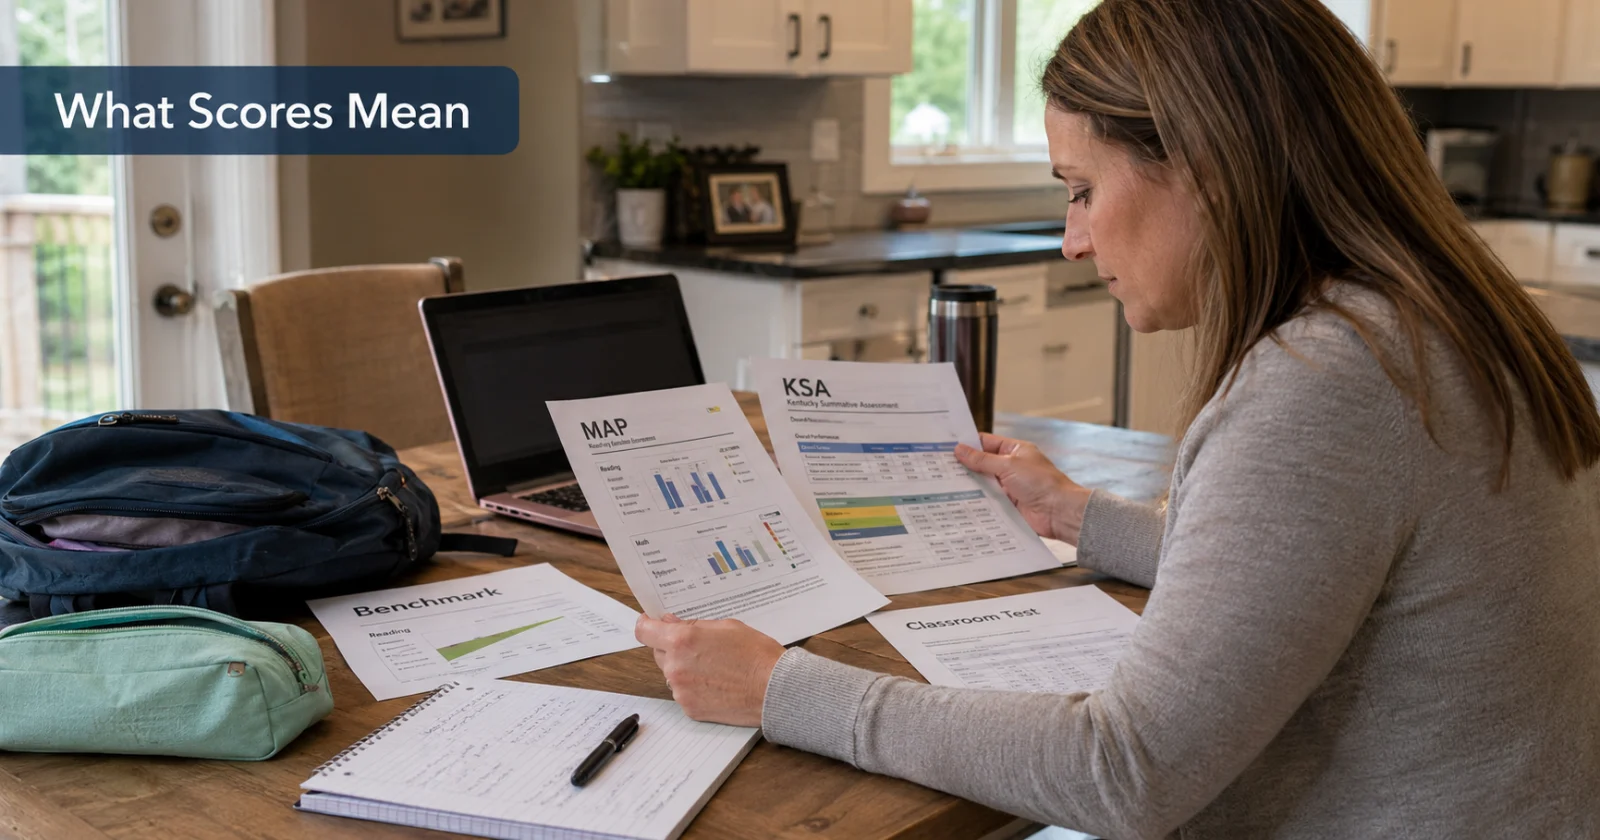
Your child comes home with an 82nd percentile on MAP. Infinite Campus shows an 88 on the latest math test. Then last spring's KSA report says Apprentice.
So which number tells you how your child is actually doing?
All of them can. They just aren't interchangeable.
JCPS uses MAP Growth during the school year. Kentucky administers KSA near the end of the year. Teachers use classroom assessments throughout instruction, and schools may also talk about benchmarks, screeners and other assessments.
Start with one question:
What was this test designed to tell me?
MAP shows achievement and growth during the school year
JCPS administers MAP, or Measures of Academic Progress, in reading and math in the fall, winter and spring. The district uses the results to measure student performance and growth during the school year.
MAP is adaptive. As a student answers questions correctly, the test can move to harder material. When a student struggles, it can adjust in the other direction.
Students aren't expected to get everything right.
That makes a MAP score very different from the percentage grade on a classroom test.
The number parents are likely to see first is the RIT score. NWEA uses the RIT scale to measure achievement and track academic growth over time. It is an equal interval scale, more like a ruler than a percentage grade. A change of 10 RIT points represents the same amount of growth whether a student moves from 180 to 190 or from 230 to 240. NWEA explains the RIT scale here.
Then there is the number many parents understand more quickly: the achievement percentile.
If your fourth grader is at the 75th percentile in math, that does not mean your child answered 75 percent of the questions correctly.
It means the child's score was equal to or higher than the scores of about 75 percent of students in the national comparison group for that grade and subject.
A student at the 50th percentile is roughly in the middle of that comparison group. An 85th percentile score does not mean 85 percent of Kentucky's grade level standards have been mastered.
Achievement percentile and growth percentile are not the same number
This is one of the easiest MAP results to misread.
Achievement percentile asks: How did my child perform compared with other students?
Growth percentile asks: How much did my child grow compared with students who started in a similar place?
A child can score well above average and still have ordinary growth. Another child can remain below the national average while making unusually strong progress.
Imagine a student who starts the year far below average but makes a substantial jump by spring. The achievement percentile may still be below 50, while the growth result tells a much more encouraging story.
Growth also requires something to compare. A fall MAP test by itself cannot show how much a student grew from fall to winter or fall to spring.
JCPS has made MAP especially significant in its own academic goals. The district's Goals and Guardrails include targets tied to spring MAP performance in third grade reading and eighth grade math.
For the 2026 to 2027 school year, JCPS is targeting 72 percent of third graders meeting or exceeding the district's expected growth or achievement benchmark in spring MAP reading and 67 percent of eighth graders doing so in math.
KSA is Kentucky's end of year state test
KSA, the Kentucky Summative Assessment, measures students against the Kentucky Academic Standards.
Students receive a scale score and one of four performance levels:
Novice
Apprentice
Proficient
Distinguished
Those levels are not classroom grades.
A KSA scale score of 520 does not mean a student earned 52 percent. Kentucky sets different score ranges by grade and subject, which is why the performance level usually tells a parent more than the scale score by itself.
KDE also publishes Performance Level Descriptors for each grade and subject. Those descriptions go beyond the label and explain the kinds of knowledge and skills associated with each performance level. Parents who want to dig into a KSA report can find them on the Kentucky Summative Assessment page.
Who takes KSA in 2026 to 2027?
KSA is scheduled during the final 14 instructional days of a district's calendar.
Reading and math are tested in grades three through eight and grade ten.
Science is tested in grades four, seven and eleven.
Social studies is tested in grades five, eight and eleven.
There is also a change this year.
Kentucky removed the KSA writing and editing and mechanics assessments beginning with the 2026 to 2027 school year following legislation passed earlier in 2026.
Parents waiting on results from last spring's tests are dealing with the previous system, which still included writing. Kentucky's current schedule lists October 15, 2026, as the tentative public release date for the 2025 to 2026 School Report Card.
Individual student results can reach districts before the statewide public release, so parents who have not received their child's report can ask the school when it expects to send results home.
MAP can help predict KSA, but don't try to convert the scores yourself
NWEA's current Kentucky linking study matched MAP Growth and KSA results from 162,281 students in 92 Kentucky districts who took both tests in spring 2022. The study was updated in 2025 to use NWEA's newer norms.
For every reading and math grade combination studied, the correlation between MAP and KSA scores was at least 0.71. NWEA considers 0.70 or higher a high correlation and says those results support using MAP to predict likely KSA performance.
NWEA also publishes MAP RIT cut scores and proficiency probabilities that can help educators estimate whether a student is on track to reach Proficient on KSA. But the company cautions that the cut scores in its technical report can differ from a district's actual MAP reports because districts do not all test during exactly the same instructional week.
So an 80th percentile MAP score should not simply be translated into Distinguished on KSA.
Use the projection your school has, not a homemade conversion.
What does a benchmark score mean?
This is where parents may need to ask one more question.
Which benchmark?
Kentucky uses the term interim or benchmark assessment for assessments given during the school year to monitor progress toward longer term learning goals. Schools and districts can use them to identify strengths, gaps and instructional needs.
MAP can serve that kind of purpose. A school may also use curriculum based assessments or another testing program and call those results benchmarks.
So if a teacher says your child is below benchmark, ask what the benchmark is measuring.
Is it checking material that has already been taught?
Is it measuring progress toward an end of year standard?
Is it being used to identify students for additional support?
"Below benchmark" sounds definitive. Without knowing the assessment, it isn't.
Classroom tests can tell you something the big tests cannot
A classroom quiz or unit test usually has a much narrower job.
If a fifth grade class just finished a fractions unit, the test at the end of that unit can show whether your child understood those specific lessons. A broad MAP score cannot give you that same immediate picture.
Classroom grades can also reflect work that never appears on a standardized test, including projects, written responses, assignments and work completed over time.
JCPS parents can use Infinite Campus to see grades, attendance and other student information.
Kentucky itself warns against using a single assessment as the sole basis for an educational decision. KDE says state test results should be considered alongside classroom activities, grades, quizzes, tests and district assessments.
What if the scores seem to contradict each other?
That's when the numbers become useful.
Suppose your child has a strong MAP percentile but a much weaker classroom grade.
Look at the assignments. Are missing assignments hurting the grade? Is writing part of the problem? Organization? Are the classroom tests themselves showing weakness, or is something else dragging down the average?
Now flip it.
If classroom grades are strong but MAP suddenly drops, compare that MAP result with previous testing windows. One unusual testing session is worth a conversation before anyone decides a student has suddenly fallen behind.
If last year's KSA result was Apprentice but this year's MAP scores show strong growth, both can be true. Your child may have ended last year below Kentucky's proficiency threshold and since made substantial progress.
You don't have to pick which score to believe. Ask why they aren't telling the same story.
Five questions worth asking at the next parent teacher conference
You don't need to become an assessment expert.
Bring the score report and ask:
Is this number showing achievement, growth or mastery?
How does my child's performance compare with grade level expectations?
Which specific skills appear strongest?
Which skills need the most work?
Do MAP, classroom work and other assessments generally tell the same story?
If the answer to the last question is no, ask why.
That conversation is often more valuable than chasing a particular percentile.
A test score should help identify what your child knows, where your child is growing and what should come next. No single number can do all three jobs.